Bonus points for the title because I have pet rabbits.
My sister and I both have our computers in the same room. This is important because it means that when something exciting happens while she’s playing a game, I usually notice.
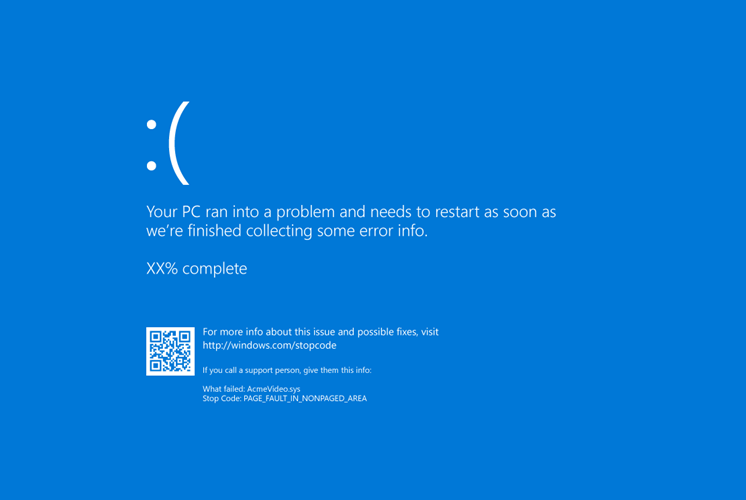
In this instance that “exciting” thing was Terraria glitching out1 and then crashing (and blue screening?) her PC. I’m a little fuzzy about whether the first blue screen was now or later.
After that, the save was essentially corrupt – loading it either didn’t work or would crash the game. Also fuzzy about which of those it was, but you get the gist. My sister wiped that save, made a new world, and everything was fine.
..At least for a while.
At some point either that day or the next, the computer blue screened (again?).
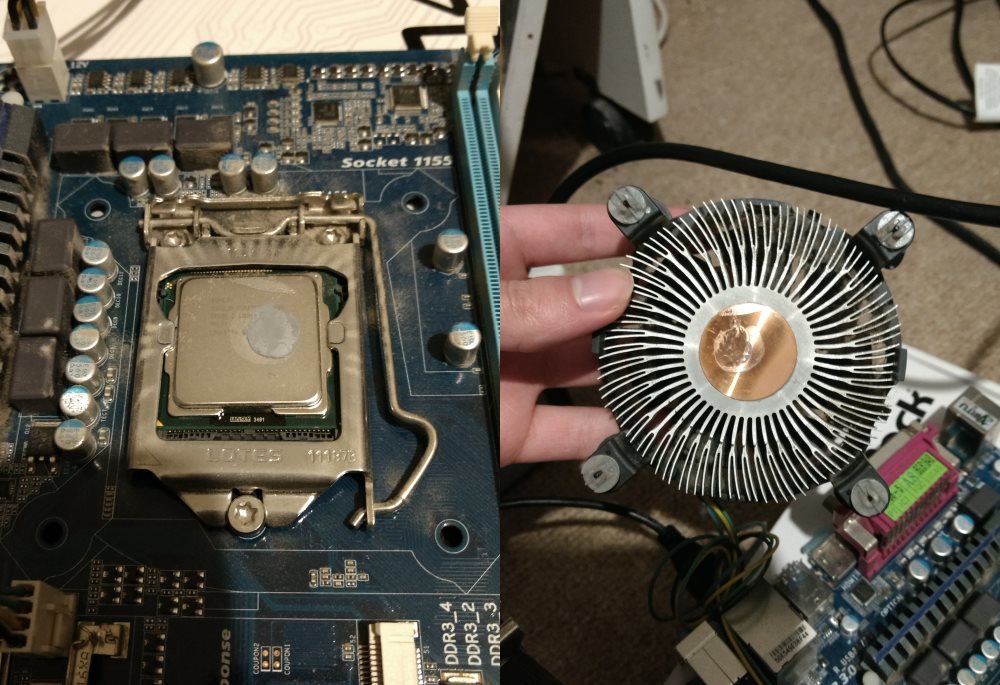
This was not great. A number of things came to mind as possibly related. Her CPU is actually second hand from a friend (The bricked system mentioned in the PC of Theseus), and my friend.. did not take great care of it. Not that it was intentional, but I’d bet money that the CPU regularly thermal throttled under normal usage because of (what I eventually discovered was) most of its thermal paste drying out somehow.
Not only that, but my friend actually previously had memory issues with this CPU and motherboard. Previously I’d naturally believed it to be unrelated to the other hardware, but now I was starting to wonder if there was a longer term issue at play. Did that extended exposure to absurd operating temperatures damage something?
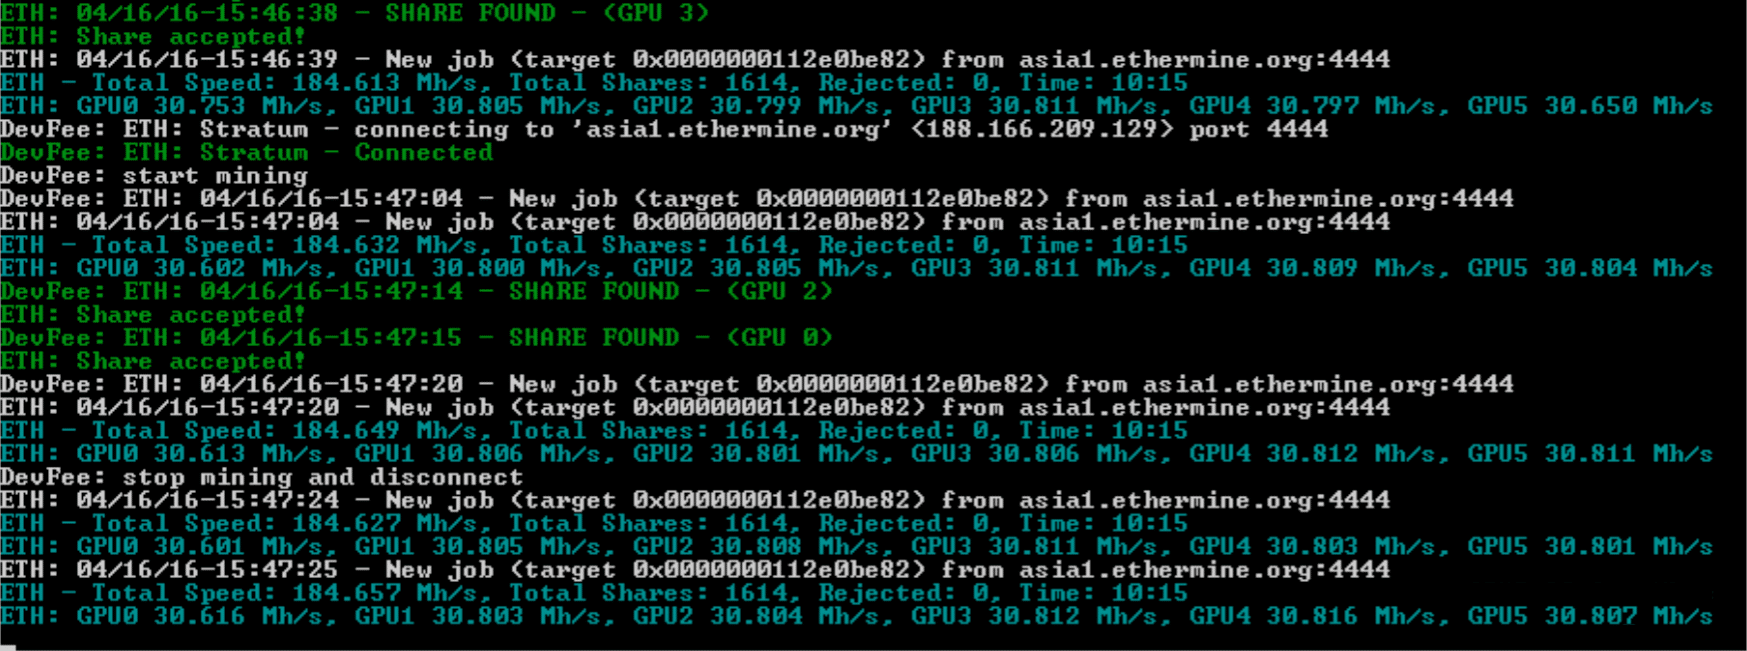
One less troubling potential cause was related to a more recent change in hardware. Around a month ago, I swapped out her graphics card (my old GTX 660) for a couple of GTX 1070 Tis. A friend had expressed interest in venturing into mining but was super insistent that they wanted me to run all the hardware in person, so my sister graciously agreed to house it in her system (..which also let her get a massive GPU upgrade for the duration of the mining project).
Mining can sometimes use up a lot of system memory in addition to GPU memory, and it’s often recommended to manually increase the page file size in Windows so that this doesn’t become an issue. This was obviously the least painful answer, and would be an easy fix if this was somehow the cause of the blue screening.
In any case, guessing was not required.2 I had asked my sister to make a note of when the blue screens occurred so that I could check timestamps for any logs and such. Firing up Event Viewer later on her machine provided the first insight into the potential cause: an error code.
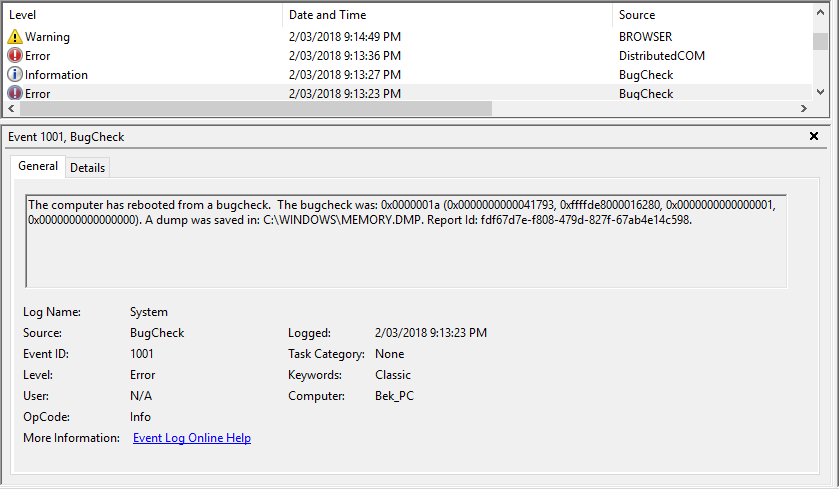
A quick search lead to a helpful list of blue screen (bug check) error codes from Microsoft. Technically “0x0000000a” wasn’t on the list, so I was hoping that “0x0000000A” (uppercase “A”) was interchangeable within this context.
0x0000000a is for “IRQL_NOT_LESS_OR_EQUAL”. If you know exactly what that means, then you’re probably much more of a software developer than I am. According to Microsoft, that means that “Microsoft Windows or a kernel-mode driver accessed paged memory at an invalid address while at a raised interrupt request level (IRQL). This is typically either a bad pointer or a pageability problem.” Haha yeah, me too thanks.
Fortunately there were slightly less technical explanations under the “Cause” and “Remarks” sections respectively, which were at a level which I could better follow along with: “Bug check 0xA is usually caused by kernel mode device drivers using improper addresses.” and “The error that generates this bug check usually occurs after the installation of a faulty device driver, system service, or BIOS.”
Okay, so maybe my sister recently plugged a new device into her computer and it was tripping something up. I was also still thinking it might be related to the crypto mining, and given that the virtual memory thing was the easiest solution to implement, I started with that. I switched from an automatically set page file to a min/max of 6GB/12GB. Usually I would’ve set higher values in this situation, but she has a BX100 250GB that was getting slightly too full to dedicate much more to potential page file space.
I let her know that I was around 40% sure that I’d done something to fix the problem and to see if it worked.
It didn’t.
In the back of my mind I continued to wonder if I had still inadvertently caused the problem with something I had installed (hardware or software) in the mining endeavor. While I continued on with other things, my sister reported that the frequency of the blue screens had actually increased since I began my troubleshooting. Whether I was at fault or not, the problem wasn’t getting better. It was getting worse.
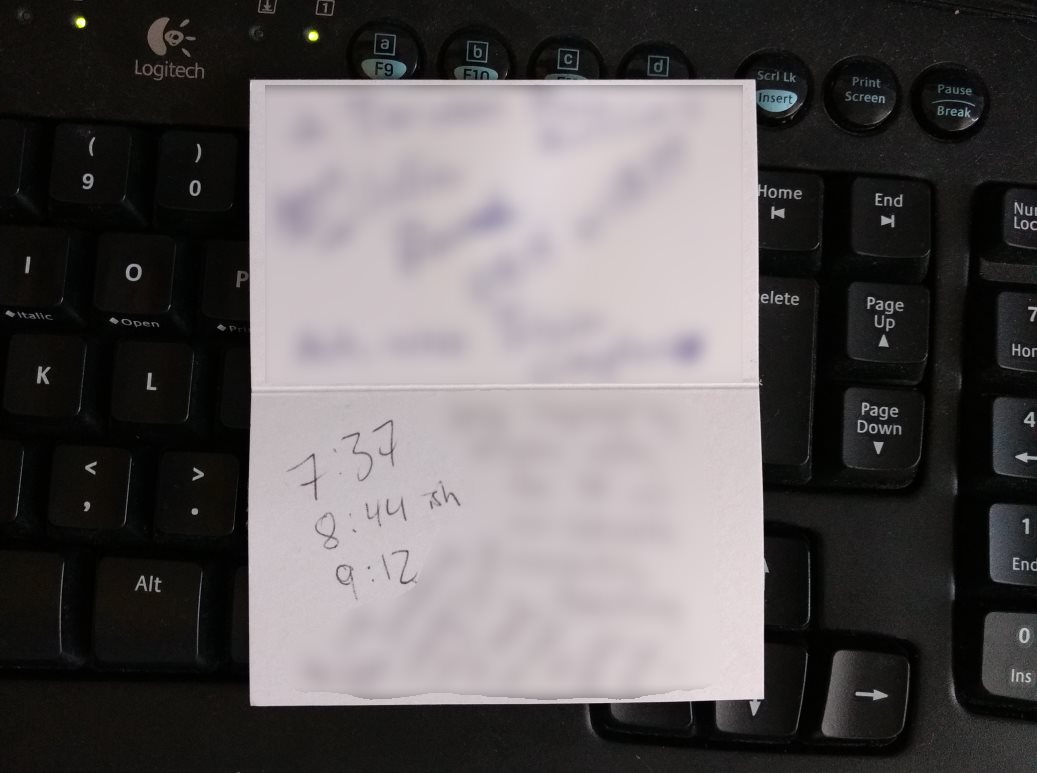
I set aside an evening to troubleshoot the problem further after she had finished using the computer for the day. Helpfully, she had left a few rough timestamps scribbled down on a scrap of paper of when the blue screens had happened. If nothing else, that let me verify in Event Viewer that the error codes given each time were at least the same, which they were.
Microsoft has apparently done some analysis of what causes blue screens, and they report the following spread for root causes:
- 70 percent are caused by third-party driver code
- 10 percent are caused by hardware issues
- 5 percent are caused by Microsoft code
- 15 percent have unknown causes (because the memory is too corrupted to analyze)
So odds were pretty good (better than 2 to 1) that it was going to just be a driver issue or something of the like.
I continued my research, leading me to a forum article on Microsoft Community titled “BSOD Finding and fixing them“. Technically the process they outline is so that a troubled user can upload relevant files for others to assist them, but being the all powerful tech wizard that I am, I would be my own assistance for this problem. Plus you know, the internet, but whatever man.
Minidumps (like a smaller version of a full memory dump file) were already enabled on my sister’s Windows 10 installation, so I got to skip through that part of the process. The next step described was… basically to just upload the minidump(s) and Let The Experts Deal With It. Fortunately, I’m an Expert.
Somewhere along the way during my research, I found a second Microsoft Community post pertinent to the situation: “Driver Verifier– tracking down a mis-behaving driver.” Given that a driver issue was apparently the most likely reason for the blue screens, this sounded like an extremely helpful troubleshooting step. I had no idea that Microsoft nestled a tool like this inside Windows, but now that I knew about it I was damn sure going to make use of it.
I followed the steps recommended in that article: run every test except for “Randomized low resources simulation” and “DDI compliance checking” (because my sister’s computer runs Windows 10), and select the tests to run on every every non-Microsoft driver on the system. The next step required the system to reboot, at which point Driver Verifier would monitor for any issues.
The machine blue screened during the reboot.
On the screen it proudly announced that the stop code was “DRIVER_VERIFIER_DETECTED_VIOLATION”, which seemed like a good sign because it meant that Driver Verifier noticed something wrong and pulled the plug.
The fun part of the next couple minutes was that Driver Verifier doesn’t automatically stop itself after it causes a blue screen, so the computer would simply blue screen, reboot, and then blue screen again. I’m not sure if one is supposed to find that sad or funny, but I found it some of both. Probably more on the funny side.
After a number of these cycles, Windows, the smart devil that it is, decided “I’m done with this self destructive behavior and it’s time to make a change”, offering me a selection of options to choose from. If only humans were this good at identifying the same.
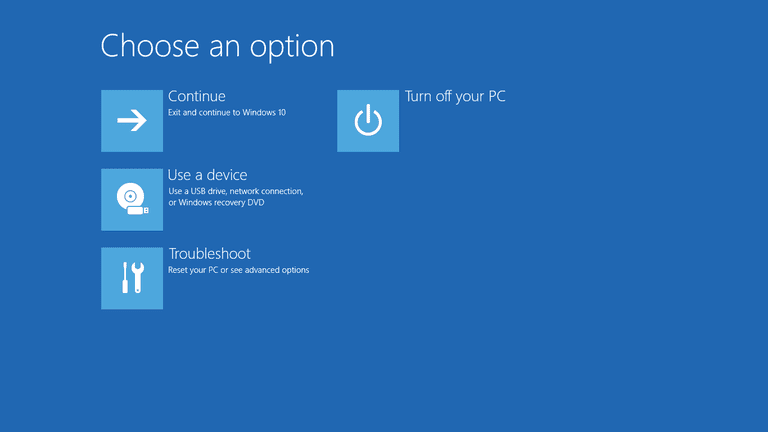
The next step was to boot the machine into safe mode (where Driver Verifier wouldn’t be enabled) using the options presented. I did so and rebooted, and this time the computer completed a regular boot without any interruption during the boot process. From there I could disable Driver Verifier and do a regular reboot.
The good news is that the brief moment of cyclical suicide-by-drivers left me with a handful of separate minidumps to sift through later – presumably more data points meant that I could more easily pin down whether the problem was the same each time. So far so good.
With minidumps in hand, it was time to put them under the microscope and find out what the problem was. The first part of that process was to actually open the dump files. Given that I’d just discovered Windows had an integrated tool for seemingly-advanced levels of driver verification, I honestly expected there to be a way to natively open or view the dump files.
There wasn’t.
Another browser tab dedicated to this new search task yielded a Microsoft Support page that seemed to be exactly what I was looking for: “How to read the small memory dump file that is created by Windows if a crash occurs“. From there, I found another linked Microsoft support page: “How to use Dumpchk.exe to check a Memory Dump file“, which also seemed to be exactly what I was looking for. The parent page did note that the child page was for Windows 7, but seeing as I couldn’t see another page for newer versions of Windows,3 I figured maybe the page was old or outdated and that if I had to, I could probably adapt the “Windows 7 steps” given to work on a Windows 10 install if everything was compatible.
That page told me to go to a third page to download “debugging tools for Windows products”, which would include Dumpchk.exe – a tool that would let me peer into the content of these dump files. That link was a 404.
Heading back to Parent Page, I noticed another option presented that would be able to read the dump files – Windows Debugger (WinDbg.exe) and Kernel Debugger (KD.exe) would apparently both do the job, and were available from the “Download and Install Debugging Tools for Windows webpage“. That didn’t end up where I’d expected, as it was a redirect to “Download the Windows Driver Kit (WDK)“. This page was asking me to install Visual Studio 2017 as well as the entire WDK just to use one of the two tools. Surely there was a less roundabout way to just open a dump file.
I’m unsure which page I eventually got the link from, but at some point I ended up on “Debugging Tools for Windows (WinDbg, KD, CDB, NTSD)“, which actually seemed to be the page I was trying to get to earlier before the redirect. This page also mentioned that I could get the tools by downloading the whole WDK, but more importantly specified an alternative option: the Windows Software Development Kit (SDK), which would allow me to install only the components that I needed and skip everything else.
That was what I was initially after when I was told to download the whole WDK, so I went ahead and downloaded the SDK installer, then selected just the “Debugging Tools for Windows” component during the installation.
Now that I finally had access to Dumpchk.exe, I would be able to look at the contents of the minidumps. To speed up the process of opening the files (i.e. instead of using command prompt and manually navigating everywhere), I drag-and-dropped one of the dump files onto the exe, which told it to open the file. It did so, and it was doing… something.
One problem with my method of opening the file: it seemed to crash after a while. In light of this, I begrudgingly returned to the old fashioned way of typing everything out into the CLI. This ended up doing the same thing as before, but minus what I had thought was the program crashing – turns out it was just closing the Command Prompt window when it finished reading the file. Technically working as intended, but definitely not helpful for troubleshooting.
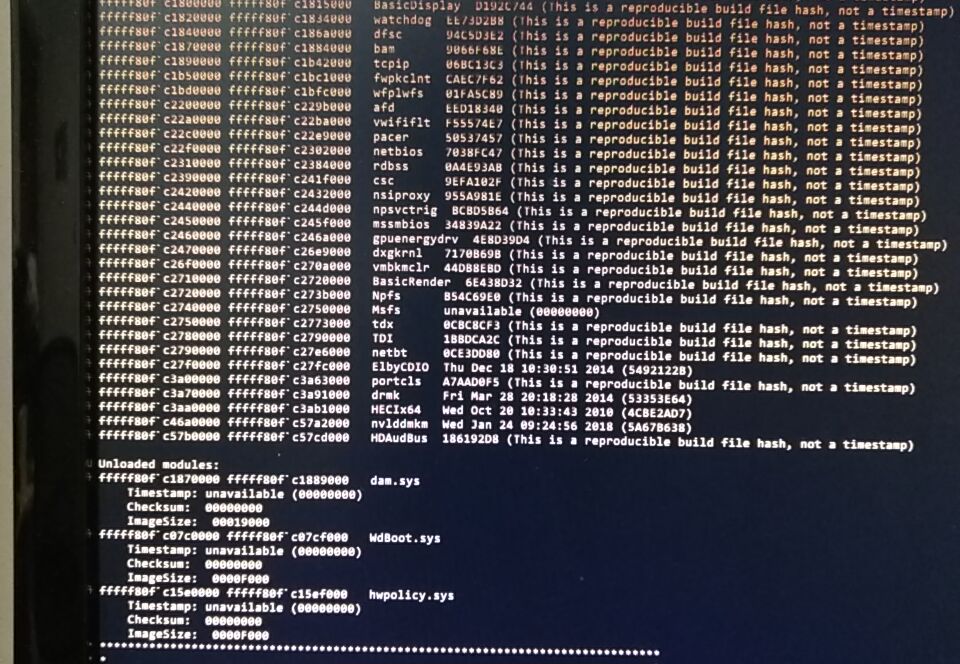
In any case, I now had what was apparently the contents of the .dmp file in front of me. I wasn’t really sure how to parse this information, so was pleasantly surprised when the program already did that for me: towards the very bottom of the text output, it displayed the result of some kind of techno-detective work.
“Probably caused by : HECIx64.sys”
I definitely didn’t know what that was, so one more browser tab was pressed into service to answer the obvious question. Turns out that “HECIx64.sys is component of everyone’s favorite integrated OS: Intel Management Engine. Swell. You may remember Intel ME from late last year when whoops, we accidentally left a crapton of computers vulnerable to an exploit because Intel ME has higher system access than even the OS (Windows) itself.
Unfortunately, “blame Intel ME – it probably caused it” was not a very actionable item. Not only did I not have a concrete cause, I didn’t have a concrete solution for the non-concrete cause. One Does Not Simply Remove Intel ME. Removing it is actually — and I’m quoting An Expert here — “impossible”.
I continued looking for more potential solutions, and encountered another relevant and somewhat interesting but ultimately not-very-practically-helpful page that detailed what the various options in Driver Verifier each do. I also uncovered a page dedicated to the previously encountered DRIVER_VERIFIER_DETECTED_VIOLATION error.
I remember the next step I took, but not how I got there. Maybe it was one of Microsoft’s many support pages, maybe it was a forum post of some kind. Regardless of the inspiration for doing so, I modified Driver Verifier’s target parameters so that it would test fewer drivers at the same time.
My first modified test was to test a single Microsoft driver (I just picked one from the list at random) as a control test. If this still caused the computer to blue screen, then any other blue screens from 3rd party drivers were less clearly a driver-caused issue. Fortunately, this control test booted up successfully without incident, implying that a 3rd party driver really was the issue.
Next up, I roughly segmented all of the 3rd party drivers into two halves so that I could start testing groups of them at time. The hope was that I could basically narrow down which driver or set of drivers caused the blue screens with Driver Verifier active, and which didn’t. I tested the first half and got our favorite DRIVER_VERIFIER_DETECTED_VIOLATION blue screen.
After that, I decided to run a second pseudo-control test, just for good measure. Because there were a number of “random” 3rd party drivers on the list from entities I wasn’t familiar with or didn’t trust as much (wireless drivers being an example of a driver I would expect to have more issues than it should), I selected just a couple of “trusted” drivers: the Realtek audio drivers, and the Nvidia GPU drivers.
DRIVER_VERIFIER_DETECTED_VIOLATION.
That was a head-scratcher. It’s not as though I expected either of these drivers to be flawless, but I did expect them to be more stable / polished than basically any of the other 3rd party drivers. Were they really the cause?
I ran a couple more tests on some of the other 3rd party drivers – each test parroted back the same blue screen code. This was a red flag for me – it was extremely unlikely to me that multiple sets of drivers — including the generally-not-totally-unstable Realtek and Nvidia drivers — had suddenly become unstable. I began to more seriously doubt that it was a driver issue: what if it was just a symptom and not the cause?
According to Microsoft my next troubleshooting step was a long shot, but I began looking at how to best test the memory. I’ve known about MemTest86 since it’s been the go-to in the enthusiast community since before I really got into computers, but I just wanted to do a quick search to check that it was still what was recommended. Sometimes tools and programs become outdated or bloated over time, so it doesn’t hurt to do a sanity check. If I didn’t find anything in a couple minutes of skim-reading, I’d just go ahead and use MemTest86.
That’s when Microsoft pulled another fast one on me – Windows actually includes a built-in memory diagnostic these days. Like holy crap, how many random utilities are there built into Windows these days – and why don’t I know about them!?! Microsoft’s ability to have all these cool useful things hidden away may never cease to amaze me. Next you’ll be telling me they developed a program that makes nicely looping gifs, complete with a public download. Pfft, that’d never happen.
Anyway, apparently the built-in tool was competent, perhaps a “MemTest86 Lite”. Green-lit by The Experts, I ran it. A prompt advised me that the computer would need to restart to run the diagnostic. That sounded reasonable, so I let it restart.
The computer rebooted into an extremely DOS-era screen that informed me it was running some tests on my memory.
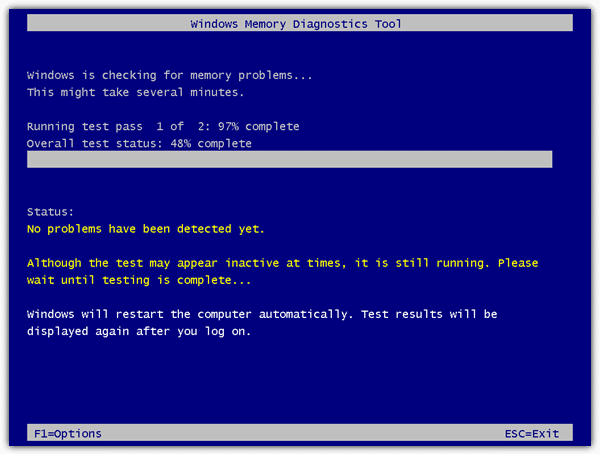
Seconds into the test, it updated its status to “Hardware fault detected” or something of that nature.
Well then.
Maybe one of the memory sticks had abruptly gone bad, with the first manifestation being that initial Terraria glitch. Maybe all of that faffing around with drivers had been for nothing other than the eventual entertainment and education of my readers.
To ensure that this wasn’t another false-positive-wild-goose-hunt, I ran a test on multiple physical configurations of the memory. The machine has 2 memory sticks and 4 slots for them, so I ran a test on each stick individually (one test came back “good”, one test “bad”), and then tested each stick in multiple slots just as a sanity check against my mild “maybe something about the cpu or motherboard is killing the memory” fear. The “bad” stick always tested bad regardless of which slot I put it in, and the “good” stick always tested good regardless of the slot I put it in.
This seemed like the true cause-and-solution, so I left the good stick in, took the bad stick out, and placed it on my sister’s keyboard. At best she would figure out that this was a “bad” stick, and at worst she would be confused. She landed somewhere in between, but surprisingly close to the former.
Having just 4GB of RAM in her machine wasn’t ideal, but it’s enough to not be painfully low. The blue screens disappeared, and I considered the problem solved. She returned to regular usage, and I returned to mining on it whenever she didn’t need to make use of the GPU power.
Normally this would be the end of the story, and I too fell into this trap. I began writing this article detailing the whole adventure, and figured that would be that.
However, at the same time that I resumed mining, I actually switched algorithms (“algos”). Long story short, I was just optimising for better average profit by switching to something else. Unfortunately it seemed that although normal usage was fine, the computer was unable to sustain the different mining load. It’d run for around an hour and then crash.
Non-miners: bear with me, as it turns out this was not a mining-related issue.

Unlike with our previous blue screens, the crashes that were happening under the new mining load were less.. announced. The computer would not blue screen with an error code – it would just shut down. That’s not so weird, but booting up the machine afterwards definitely was.
Upon first boot-after-crash, the machine wouldn’t display anything on the monitor – not even a BIOS error or something. Weirder still, apparently the peripherals didn’t “load”, because the comforting red mouse glow was conspicuously absent. Waiting for a change to occur yielded none, so you’d be forced to manually reboot the computer.
For the second boot-after-crash, the computer would get to the Windows loading screen.
And that’s it. It would never actually load Windows, and once again patiently waiting for change would yield none, so you’d be forced to go for a third boot-after-crash. Mercifully, that third boot would always be normal, with no issues of any kind evident anywhere.
At first I thought I just had overclocks that weren’t stable with the new algorithm – just like with “normal” programs, sometimes an overclock can be stable under some workloads but not under others. In the context of mining that means that sometimes you’ll be stable on one algorithm but unstable on another.
Figuring that the above was the case, I began a series of increasingly aggressive tests to pin down what the problem was.
First, I began with fairly small reductions to overclocks targetted only at memory. I was switching from something fairly core-intensive (the Equihash algorithm) to something more memory-intensive and less core focused (the Ethash algorithm, sometimes known by the name of its precursor, Dagger Hashimoto), so it made sense to target just the memory clocks. I took -25MHz off of card #2’s overclock, which was the card not running the monitor.4 Then I fired up the mining to see what would happen.
Still crashed.
I tried a larger reduction in the clocks, and included card #1 in the reduction as well this time, taking -100MHz off of the memory overclocks of both cards. 100 MHz from a previously-stable GPU overclock is quite significant as far as stability goes, so this was already supposed to be basically a control test.
It still crashed.
In a bid to be super sure about the problem, I ran a super control test, completely wiping the overlocks from not only the memory but also the core of both cards. This left them in a less-than-stock configuration because I still left them running at a reduced power limit, essentially bottlenecking the maximum load which either card would accept. On top of that, I added an underclock, putting -100 MHz on both the core and memory of both cards.
On paper, the cards would then run really slow, but would be stable.
They ran really slow.
They were not stable.
Now I was a little worried one of the GPUs had been damaged from use. I’d taken pretty good care of them, but also knew from Buildzoid that the Zotac Mini cards aren’t necessarily the best once you go past the mid range GPUs. To get the small size, some compromises had to be made in the board design. In theory it should’ve been fine (like I said, I take care of mining cards), but it also wasn’t implausible that I was wrong. This was especially true given that card #1 ran significantly hotter than card #2 even when using less power and with a higher fan speed. It also had a bad habit of ignoring its temperature limit, so it had been stressed more harshly than it should’ve been.
Based on my experience as a (mostly amateur) ICT technician, there was still some chance that it wasn’t actually the GPU(s) at fault though. Maybe the CPU or motherboard really did have long-term issues, or maybe the “good” RAM stick was actually bad and it just didn’t show up in the shorter Windows Memory Diagnostic test. Perhaps the SSD had some bad sectors or something along those lines, which was causing the page file to give up on life.
To get more data, I downloaded AIDA64 onto the machine and fired up the stress test. The plan was to first test all the non-GPU parts for a few hours, then switch the test to only the GPUs. If the former went smoothly but the latter failed, that would further suggest that one of the GPUs had been damaged during use.
After starting the test and initially monitoring for any immediate abnormalities (and also making a mental note of what the temperatures were for everything), I went back to doing things on my own computer to give the test some time to run.
At some point I noticed that the computer had turned off. Dammit.
I went to turn it back on, expecting the same drawn-out process of requiring a triple-boot to get things back to normal. To my surprise, the computer booted straight back up.
To my further surprise, the stress test had not actually stopped running. The computer had apparently not crashed.
As far as I could tell, the computer had just decided to enter standby while under 100% CPU usage and close to 100% memory and disk usage.

I did some looking into it, but could find no reason why removing a RAM stick would make Windows no longer recognise the difference between idle and load states.
So comes the abrupt end of the adventure: I realised that the approximately 1-hour-until-“crash” lined up with the 1-hour-until-standby timer in the Windows power settings. I changed that setting so that the computer never automatically goes into standby, and now everything runs fine.
The overclocks work fine, mining whichever algorithm doesn’t cause any problems, and there are no more random blue screens or bizarre triple-boot-cycles.
At some point it would be nice to figure out the reason that Windows has lost its power-state-judgement ability, but it’s probably more trouble than it’s worth. The computer works, so I’m just going to leave it be.5
- Something to do with iron ingots and one of the resources not being used up properly or something? I don’t play it, so I don’t really remember all of what she said.
- “Don’t think, mechwarrior, find out.”
- Looking back on this page, it does actually link more directly to where I ended up, but that’s hindsight for you.
- The card running the monitor will generally let you know much more quickly if it’s unstable via artifacts and such, so instability specifically under a mining load was much more likely to be the card not hooked up to the monitor. Previously pushing card #1 too far on the overclocks had quickly resulted in severe artifacting, so because of that experience I already knew what to look for when a display-connected card was unstable.
- I couldn’t find a good place to put this in (plus the embed doesn’t look great), but this is a potential reaction to the bad RAM stick, taken from a Paul’s Hardware video, probably circa 2016 or so: https://i.imgur.com/gt3ptQt.gifv
Thank you very much for writing these wonderful tips! Very helpful.
Awesome to hear you found it helpful – I honestly didn’t expect people to read this article! On that note, I’m super curious how you ended up here – was this just from searching online for help with something similar?